Dataframes
marimo makes you more productive when working with dataframes, the most common Python tool for interacting with data.
Display dataframes in a rich, interactive table and chart views
Select data from tables or charts and get selections back as dataframes
Transform dataframes with filters, groupbys, aggregations, and more, no code required
marimo integrates with Pandas and Polars dataframes natively. The examples on this page use Pandas, but Polars works too.
Displaying dataframes
You can display dataframes directly in the output area of a cell, by including them in the last expression of the cell:
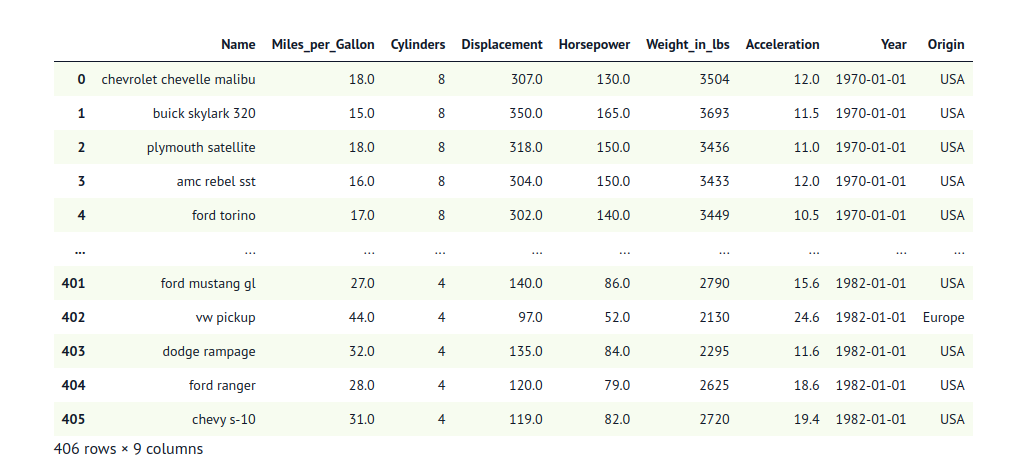
import pandas as pd

df = pd.read_json(
    "https://raw.githubusercontent.com/vega/vega-datasets/master/data/cars.json"
)
df
Rich displays.
You can display dataframes in rich tables or charts using the
mo.ui.table or mo.ui.altair_chart
elements.
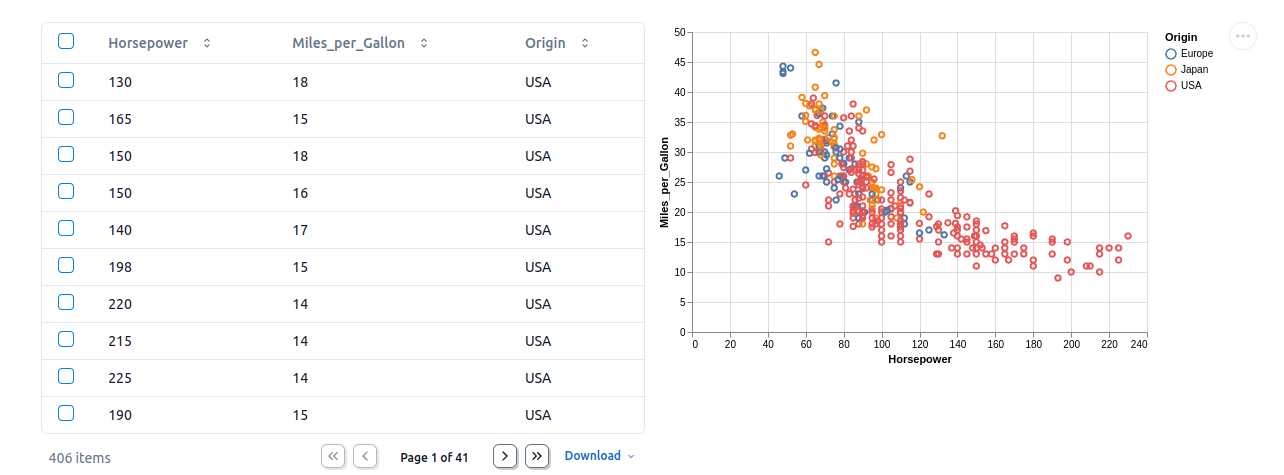
import marimo as mo
import altair as alt
import pandas as pd

df = pd.read_json(
    "https://raw.githubusercontent.com/vega/vega-datasets/master/data/cars.json"
)[["Horsepower", "Miles_per_Gallon", "Origin"]]

mo.hstack(
    [
        mo.ui.table(df),
        mo.ui.altair_chart(
            alt.Chart(df)
            .mark_point()
            .encode(x="Horsepower", y="Miles_per_Gallon", color="Origin")
        ),
    ],
    widths="equal",
)
Selecting dataframes
Select data in a table or Plotly/Altair plot, and your selection is automatically sent to Python as a Pandas dataframe.
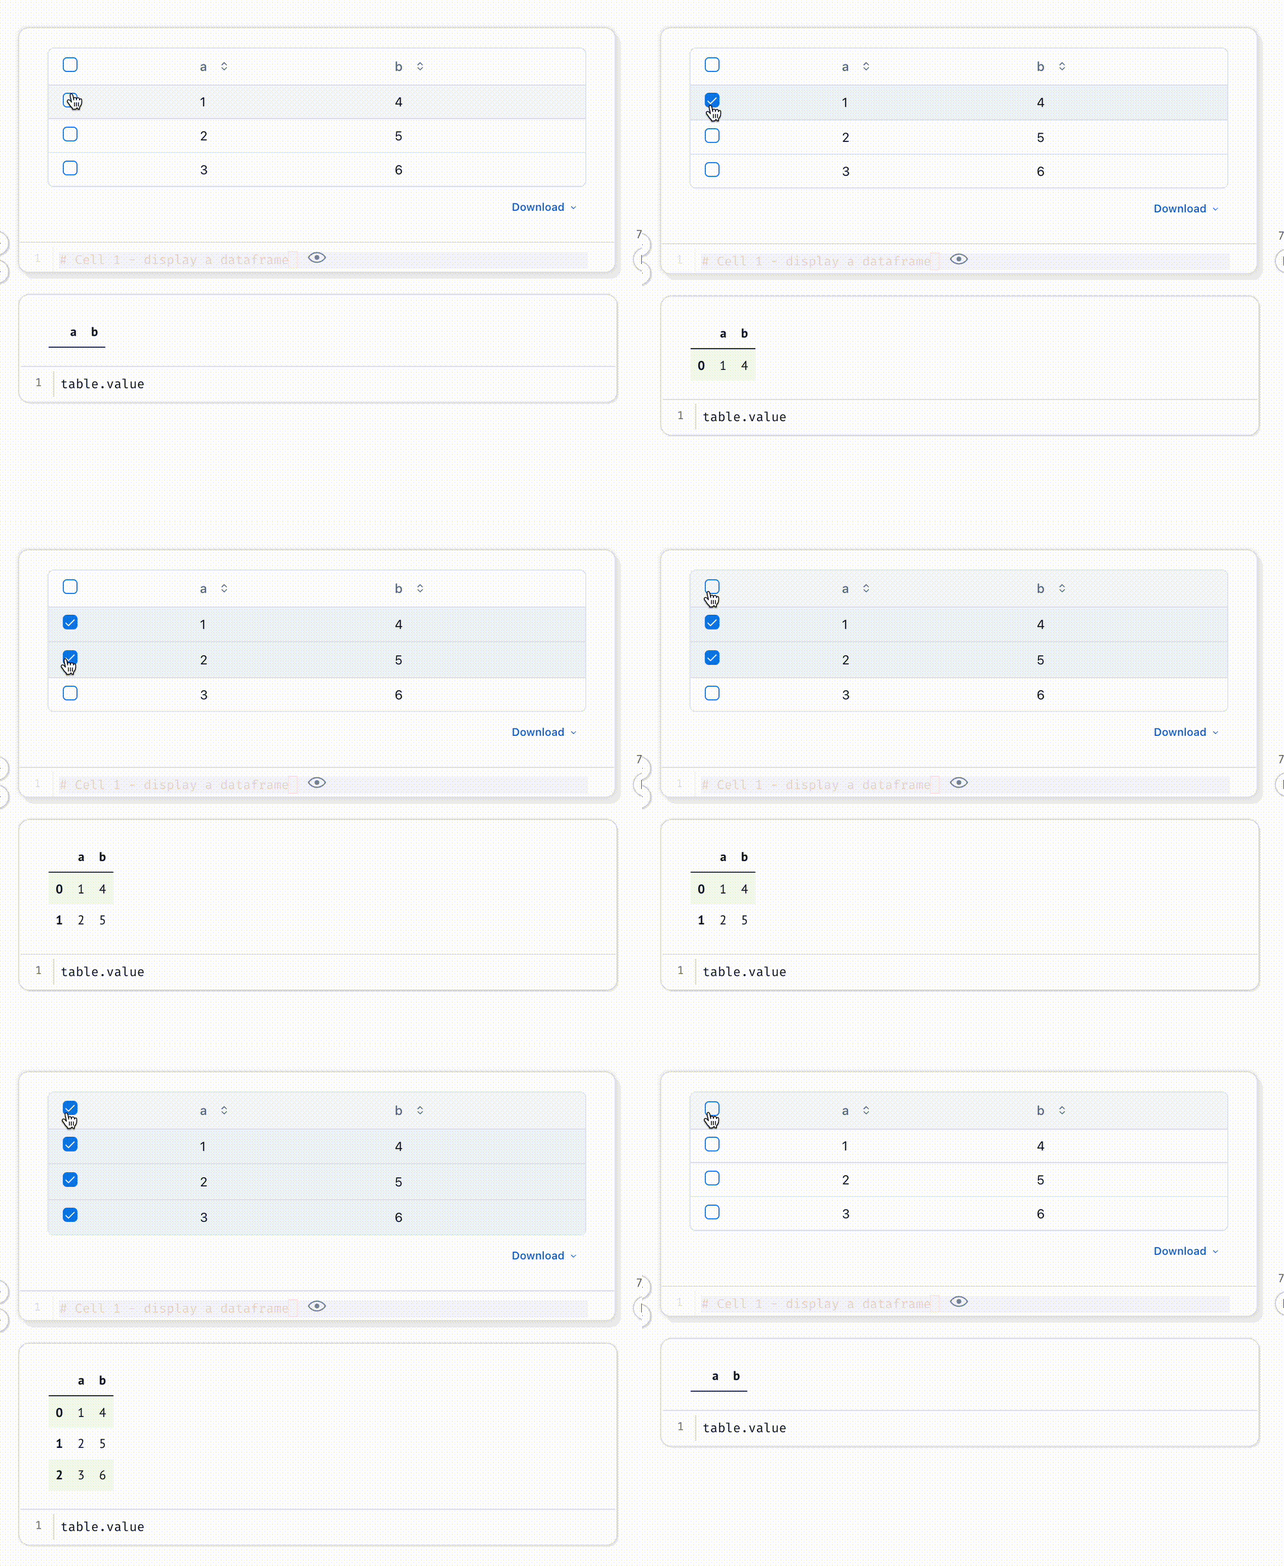
# Cell 1 - display a dataframe
import marimo as mo
import pandas as pd

df = pd.DataFrame({"a": [1, 2, 3], "b": [4, 5, 6]})
table = mo.ui.table(df, selection="multi")
table
# Cell 2 - display the selection
table.value
Transforming dataframes
No-code transformations
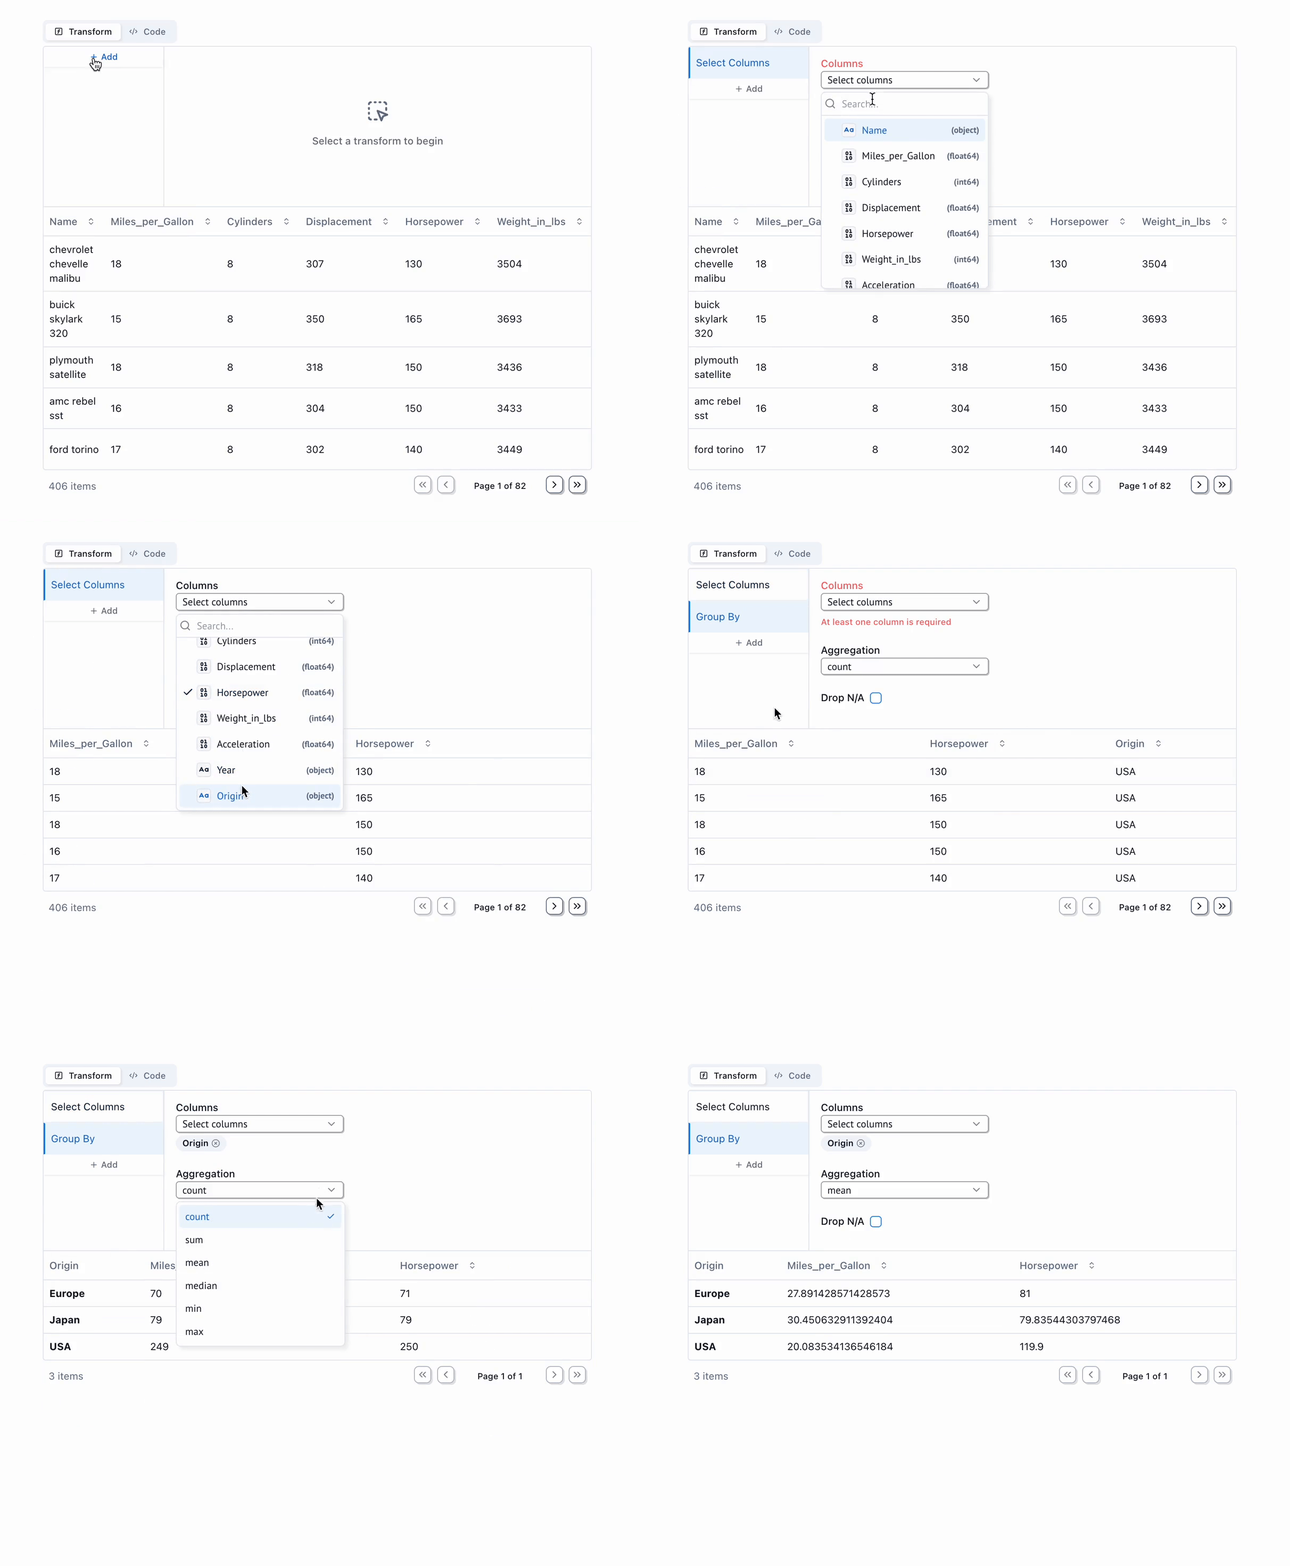
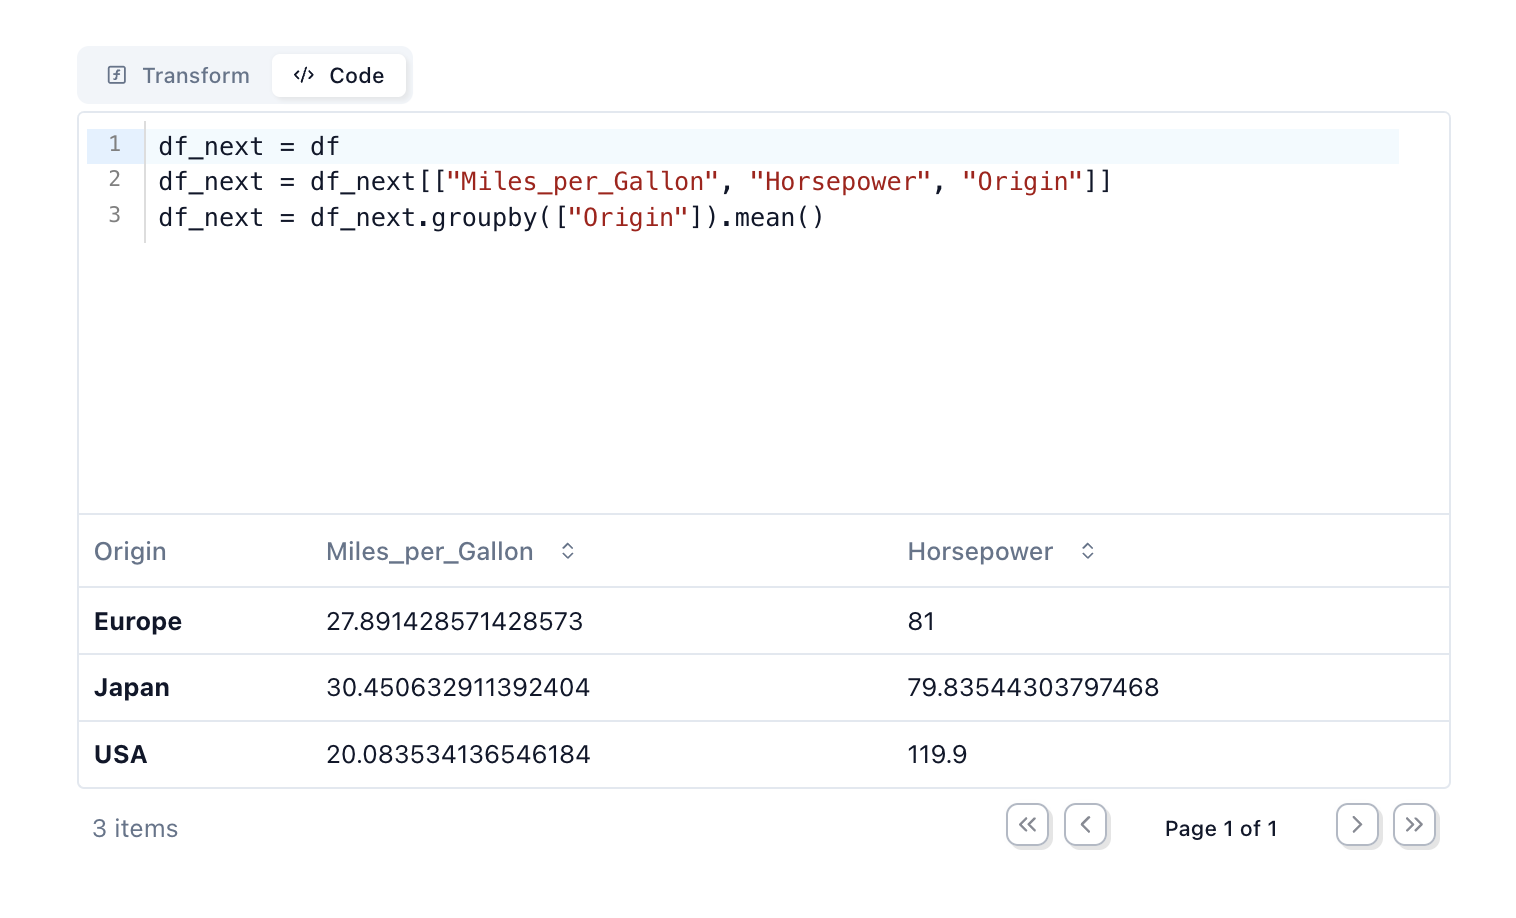
Use mo.ui.dataframe to interactively
transform a dataframe with a GUI, no coding required!. When you’re done, you
can copy the code that the GUI generated for you and paste it into your
notebook.
# Cell 1
import marimo as mo
import pandas as pd

df = pd.DataFrame({"person": ["Alice", "Bob", "Charlie"], "age": [20, 30, 40]})
transformed_df = mo.ui.dataframe(df)
transformed_df
# Cell 2
# transformed_df.value holds the transformed dataframe
transformed_df.value
Custom filters
Create custom filters with marimo UI elements, like sliders and dropdowns.
# Cell 1 - create a dataframe
df = pd.DataFrame({"person": ["Alice", "Bob", "Charlie"], "age": [20, 30, 40]})
# Cell 2 - create a filter
age_filter = mo.ui.slider(start=0, stop=100, value=50, label="Max age")
age_filter
# Cell 3 - display the transformed dataframe
filtered_df = df[df["age"] < age_filter.value]
mo.ui.table(filtered_df)
Polars support
marimo also supports Polars, a modern, faster alternative to Pandas.
Example.
Check out a full example here, or run it yourself:
marimo edit https://raw.githubusercontent.com/marimo-team/marimo/main/examples/third_party/polars.py